|
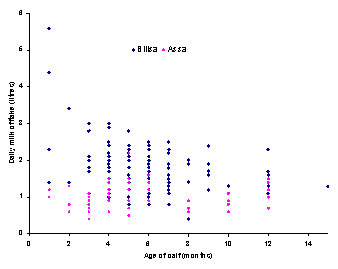
Exploration & description/Milk offtake One can pick out the four outliers in the scatter plot (Graphics → Create Graph... → 2D Scatter Plot together with use of the Tools editors). Furthermore, the distributions of the other points in the body of the figure suggest different patterns between milk offtake and calf age in the two locations. These patterns support the use of a multiple regression analysis including a term to describe different intercepts on the y-axis for the two locations.
|
